Nebula is an Eclipse Project that allows you to use hundreds of cool widgets to make your application really awesome.
XYGraph is one of them and you can use it to plot a graph with plenty of options. Let’s see how to do that.
In Eclipse menu select Help, Install New Software…, put the following Update Site in the Work with field
http://download.eclipse.org/nebula/snapshot
then expand Nebula Release Individual Widgets node
and select Nebula Visualization Widgets, finish the installation and let Eclipse restart.
Now you can create a new application with File, New, Project, Plug-in Development, Plug-in Project, Next.
Give the project a name, e.g. it.rcpvision.nebula.xygraph, Next, select
- Generate an activator, …
- This plug-in will make contributions to the UI
- Would you like to create a rich client application: Yes
Next, then select Eclipse 4 RCP application template, Next, select Create sample content …, Finish
(confirm opening Plug-in Development perspective is just a matter of taste, let’s say yes).
Now navigate and open /it.rcpvision.nebula.xygraph/src/it/rcpvision/nebula/xygraph/parts/SamplePart.java
remove the following parts
private Text txtInput;
private TableViewer tableViewer;

@Inject
private MPart part;
txtInput = new Text(parent, SWT.BORDER);
txtInput.setMessage("Enter text to mark part as dirty");
txtInput.addModifyListener(e -> part.setDirty(true));
txtInput.setLayoutData(new GridData(GridData.FILL_HORIZONTAL));

tableViewer = new TableViewer(parent);

tableViewer.setContentProvider(ArrayContentProvider.getInstance());
tableViewer.setInput(createInitialDataModel());
tableViewer.getTable().setLayoutData(new GridData(GridData.FILL_BOTH));
tableViewer.getTable().setFocus();
@Persist
public void save() {
    part.setDirty(false);
}

private List<String> createInitialDataModel() {
    return Arrays.asList("Sample item 1", "Sample item 2", "Sample item 3", "Sample item 4", "Sample item 5");
}
Press Ctrl-Shift-O to remove unused imports, Save and you’ll get an empty Part.
You can test it by selecting it.rcpvision.nebula.xygraph.product, right click, Run As, Eclipse Application: your empty application will pop-up. Now close it.
Ok, time to add the right dependencies: open (double-click) MANIFEST.MF, Dependencies tab, Add
- org.eclipse.draw2d
- org.eclipse.nebula.visualization.xygraph
in the Required Plug-ins, Save.
Then open it.rcpvision.nebula.xygraph.product, Contents tab, Add the same two plug-ins, Save
Then go again in SamplePart.java and, after line
parent.setLayout(new GridLayout(1, false));
in createComposite() method, add the following lines
Canvas canvas = new Canvas(parent, SWT.NONE);
canvas.setLayoutData(new GridData(SWT.FILL, SWT.FILL, true, true, 1, 1));
LightweightSystem lws = new LightweightSystem(canvas);
XYGraph xyGraph = new XYGraph();
ToolbarArmedXYGraph toolbarArmedXYGraph = new ToolbarArmedXYGraph(xyGraph);
lws.setContents(toolbarArmedXYGraph);
CircularBufferDataProvider traceDataProviderTraining = new CircularBufferDataProvider(false);
traceDataProviderTraining.setBufferSize(100);
Trace traceTraining = new Trace("Trace legenda", xyGraph.getPrimaryXAxis(), xyGraph.getPrimaryYAxis(),traceDataProviderTraining);
xyGraph.addTrace(traceTraining);
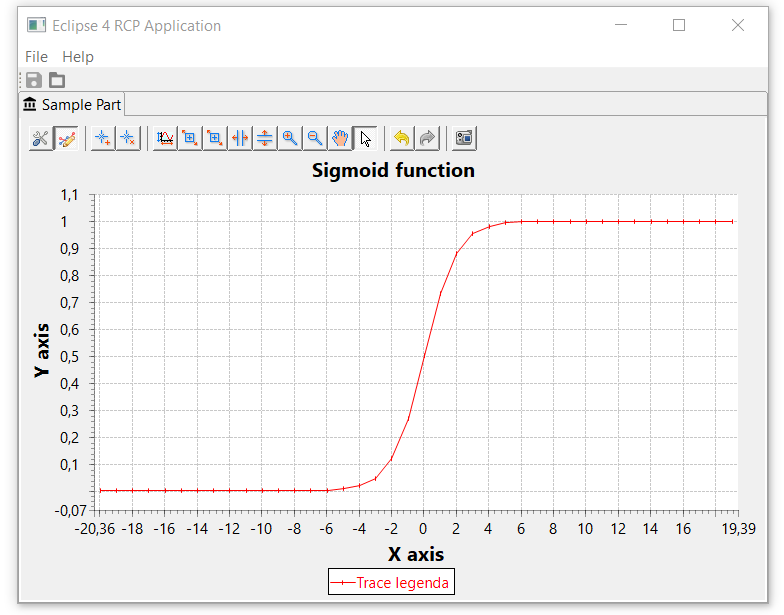
xyGraph.setTitle("Sigmoid function");
xyGraph.getPrimaryYAxis().setScaleLineVisible(true);
xyGraph.getPrimaryXAxis().setShowMajorGrid(true);
xyGraph.getPrimaryYAxis().setShowMajorGrid(true);
xyGraph.getPrimaryXAxis().setVisible(true);
traceTraining.setPointStyle(PointStyle.BAR);
traceTraining.setTraceColor(XYGraphMediaFactory.getInstance().getColor(XYGraphMediaFactory.COLOR_RED));
xyGraph.getPrimaryXAxis().setTitle("X axis");
xyGraph.getPrimaryYAxis().setTitle("Y axis");
xyGraph.getPrimaryYAxis().setDashGridLine(true);
//Plot our xy function
for (int x = -20; x < 20; x++) {
double y = 1.0 / (1.0 + Math.exp(-x));
traceDataProviderTraining.addSample(new Sample(x,y));
xyGraph.performAutoScale();
}
In the end we are ready to relaunch our application (right-click it.rcpvision.nebula.xygraph.product, Run As, Eclipse Application) and see (and play with) our new graph.
Great post, thanks! I was not aware that there was a newer version of XYGraph, still was using the one from 2016.